Web interface
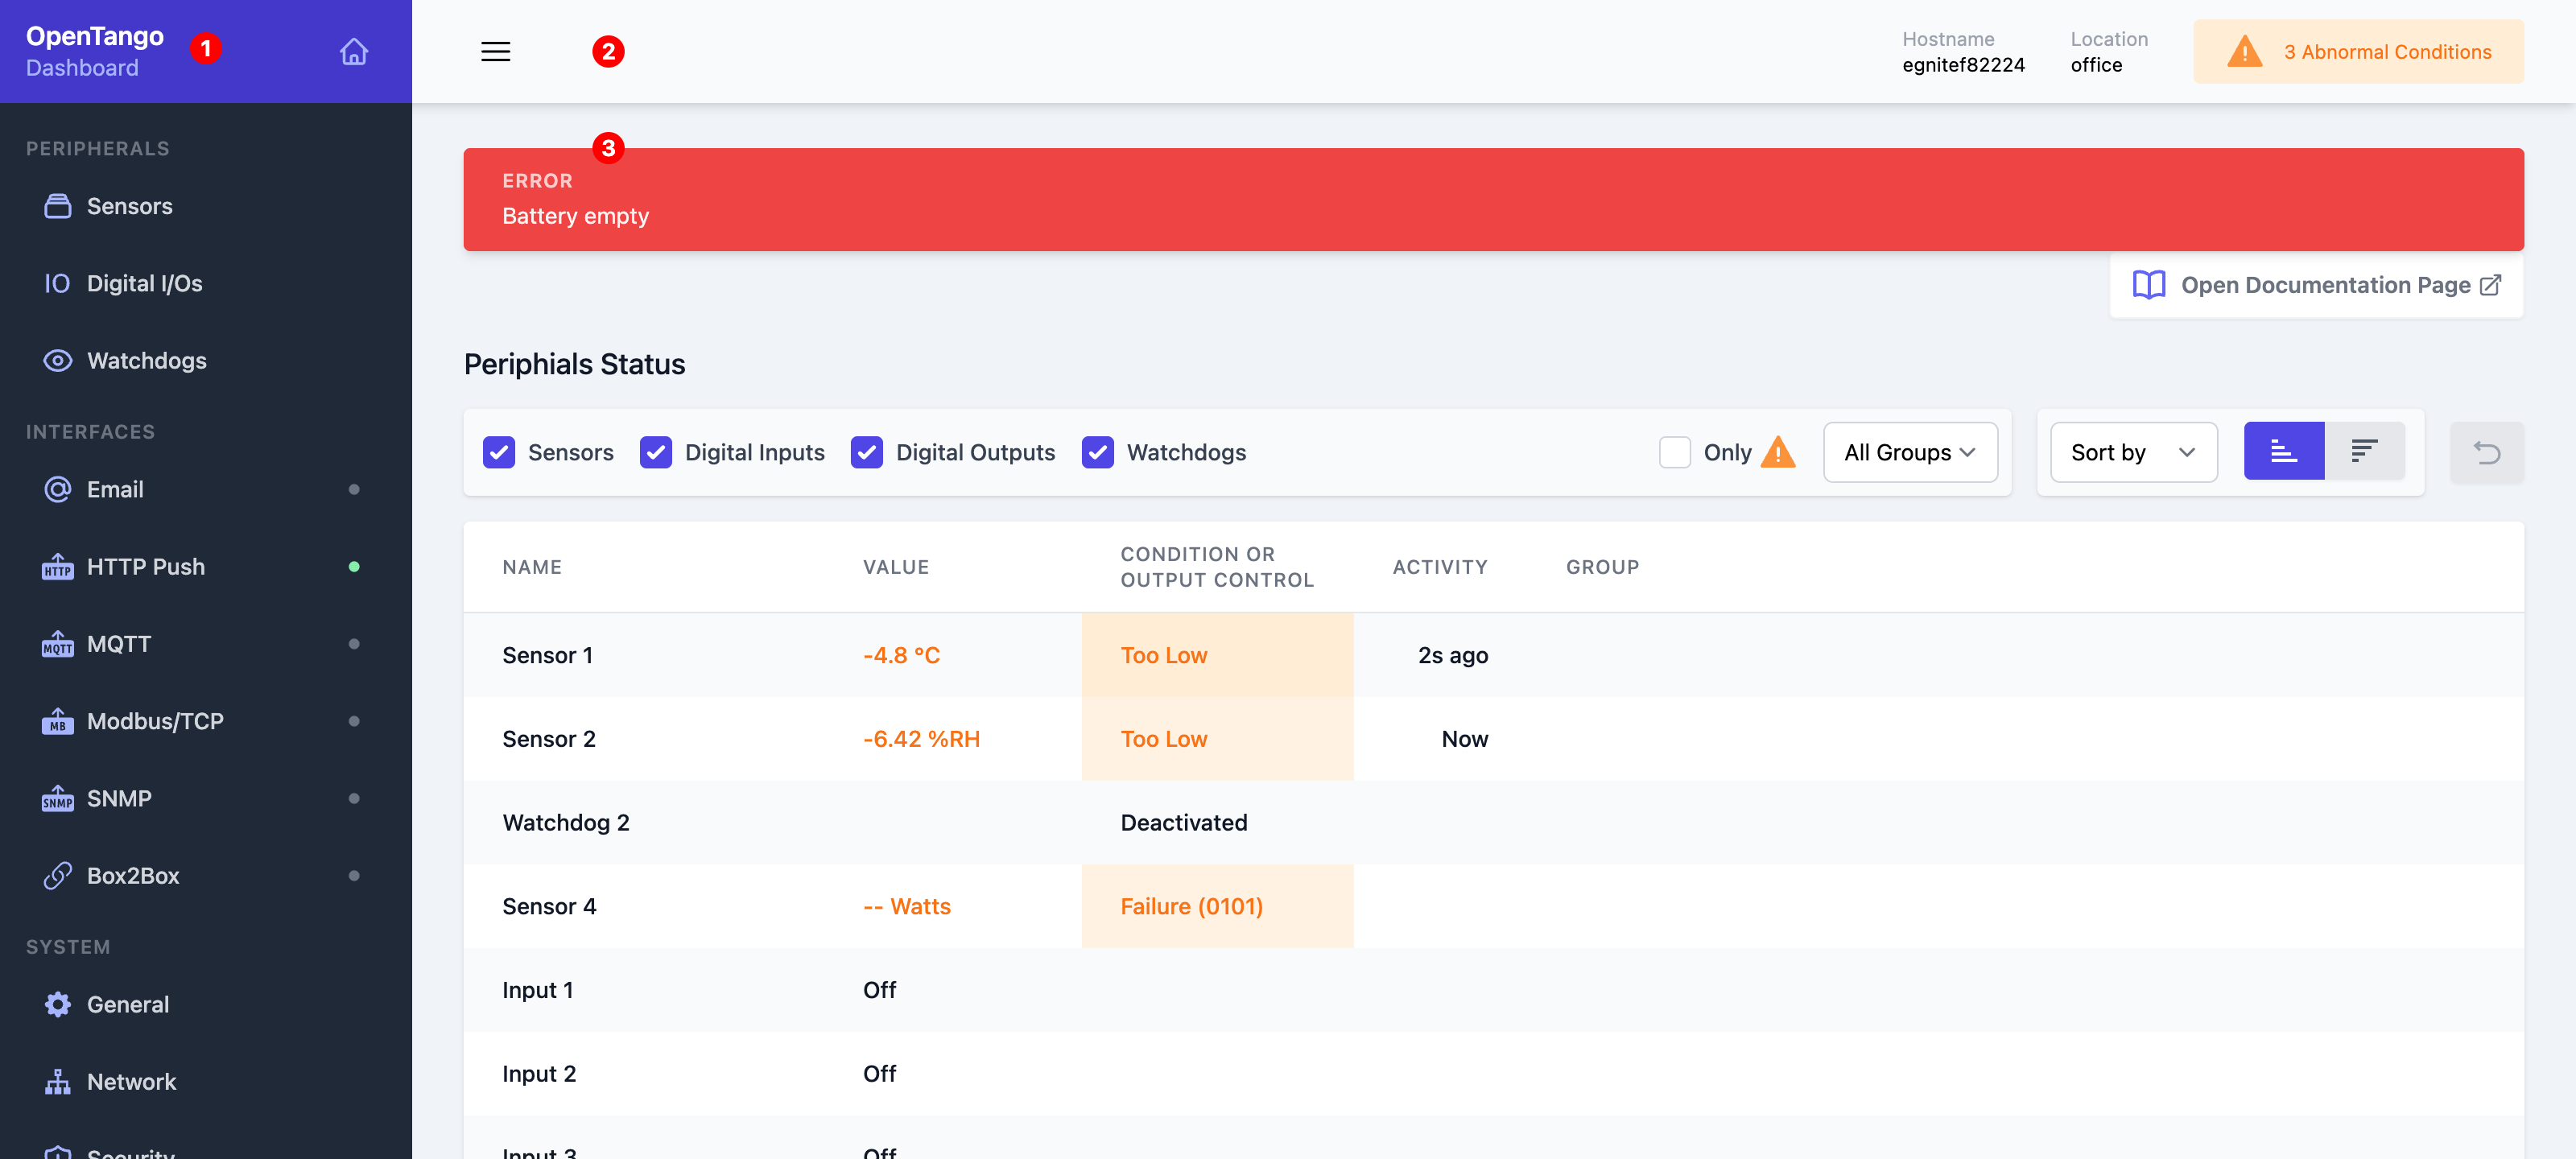
The web interface consists of three parts.
1. Main Menu
Click the purple area on the top (with the home icon) to navigate to the dashboard.
Below that, the configuration setting pages are linked, grouped by
- Peripherals
- Interfaces
- System
The page links under Interfaces feature a gray or green circle, to indicate that the respective interface is enabled or not respectively.
2. Topbar
Menu toggle
On the left hand side you will find the menu toggle button, to hide and show the main menu. The state of this persists between page loads.
On the right hand side, the hostname of the device is shown. This can be configured on General.
Next to that, the number of abnormal conditions is shown, if any.
An abnormal condition means, that a peripheral (Sensor, digital I/O or watchdog) is in a state, that is considered not normal/desired.
3. Content area
When you visit the web interface homepage, the dashboard is shown here.
Respectively the settings pages get displayed here, when navigated to.