Dashboard
Peripherals Status
This section shows the state of the peripherals (Sensors, digital I/Os, watchdogs) in a customizable table format. The information shown gets updated in real time, to give an up to date overview of the system state.
Status and Event Table controller

To customize the table display, the controller bar features multiple features, which are all optional.
Choose which type of peripherals should be included in the table.
Only show rows, that represent a peripheral that is not in normal state.
If groups are defined, select one of the existing groups from the dropdown, to only show peripherals belonging to that group.
Choose the attribute to sort the rows by from the drop down. The order (ascending/descending) can also be set.
To reset the filter and sorting settings to factory default, click on the reset button.
These settings will be saved in your browser.
Status and Event Table
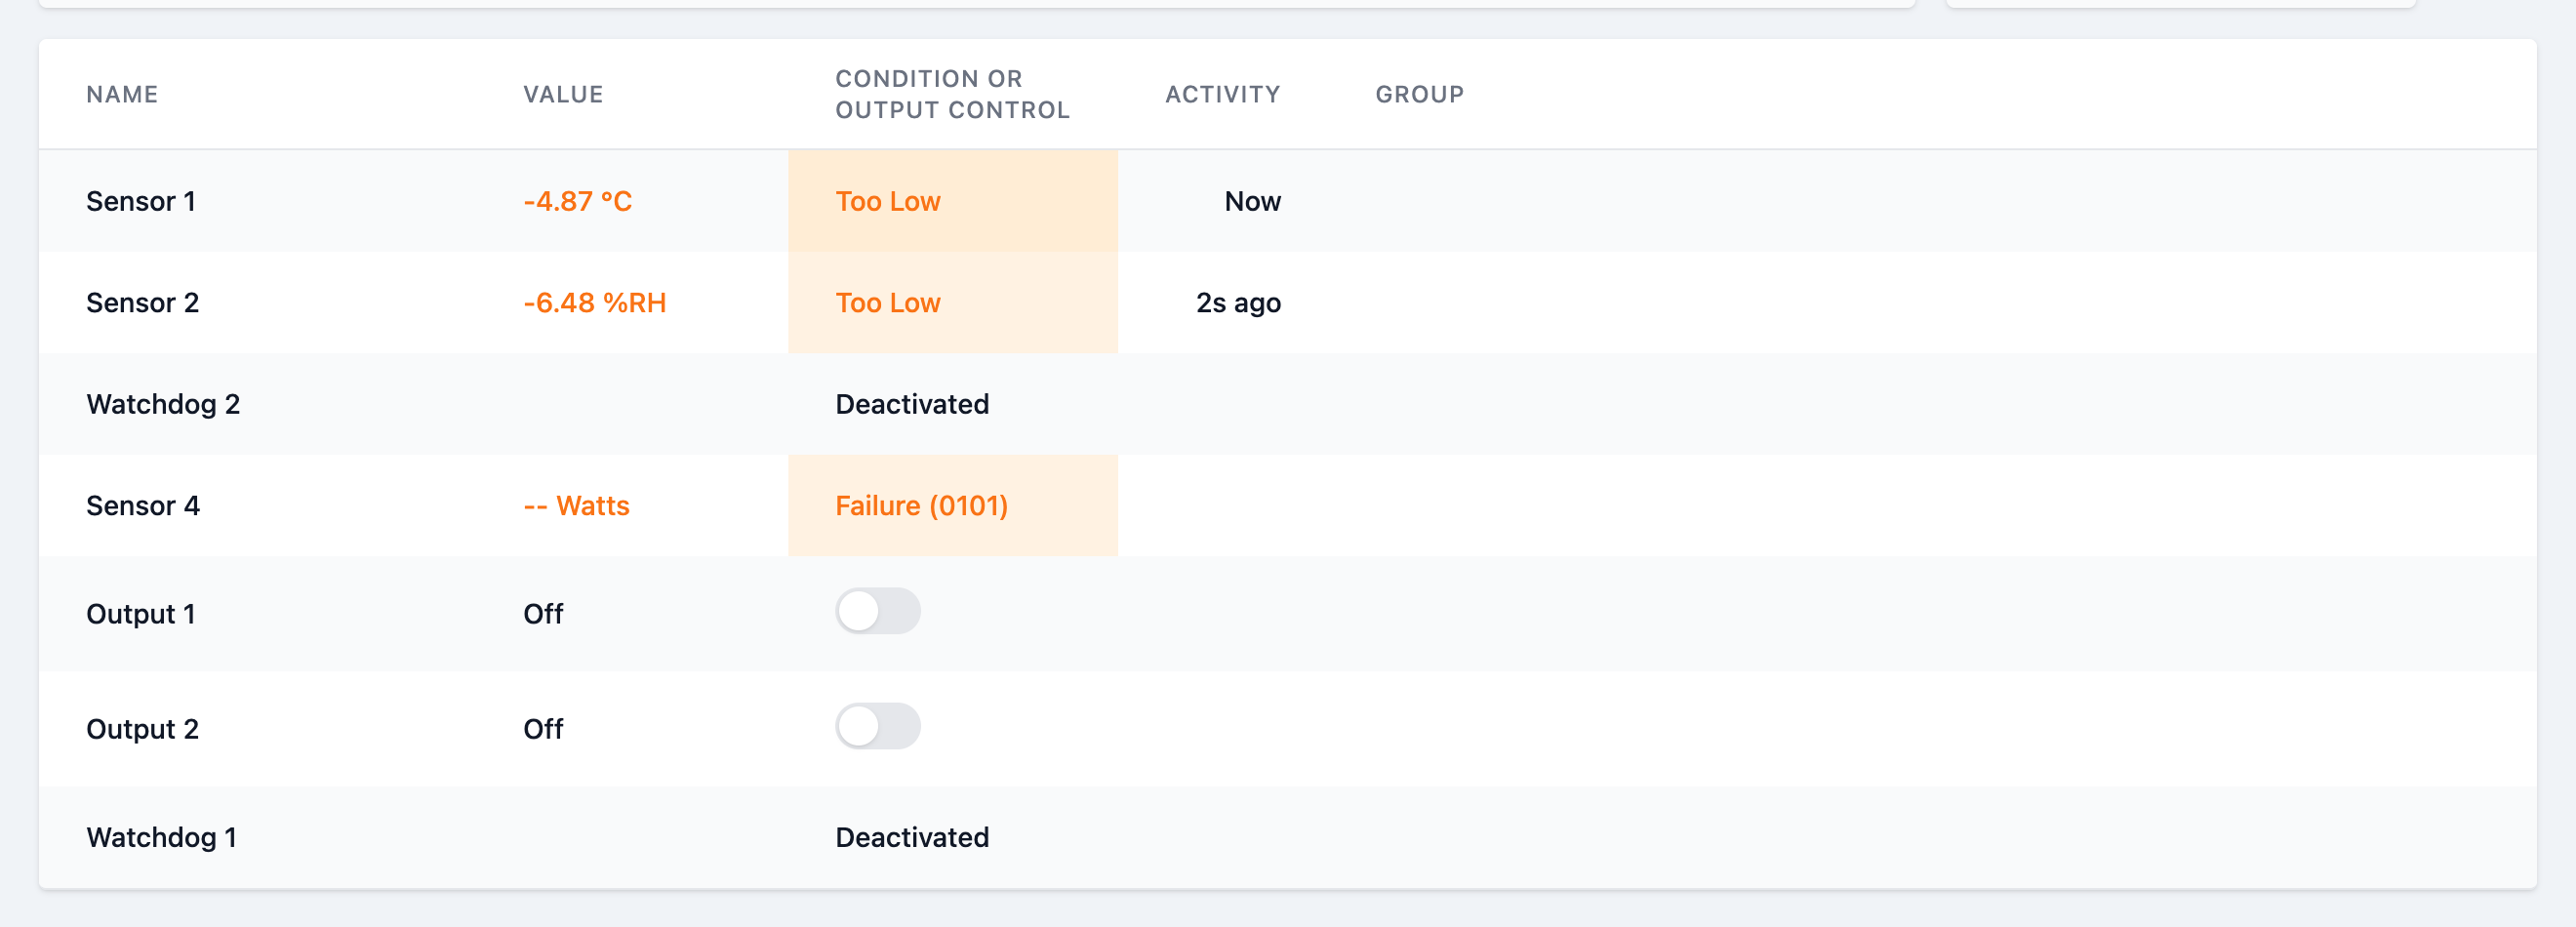
Each row represents a peripheral device. TODO: details of table cell meanings
Peripherals History
This section shows the historical data of the peripherals (Sensors, digital I/Os, watchdogs) in the form of highly customizable diagrams.
You can add (and remove) chart instances, each of which can display the data for one or more peripherals.
By default, one chart instance is already setup.
Like with the Status and Event Table, the historical data can get updated in real time.
Historical Data Controller

The settings of the controller are applied to all chart instances, if more than one is configured.
The data controller acts as a means to set the desired timeframe of historical data to show.
Click, to add a new chart instance, which will be appended below the existing chart instance(s). See Configuration and data selection for details on how to setup the new instance.
Choose a start and end date for the timespan you would like the chart(s) to display.
Choose from the provided periods.
The Date Picker and Period Picker can not be used at the same time. Setting one disables the other.
When the site reloads, the 3h period from the period selector is active.
Historical Data Charts
Chart layout
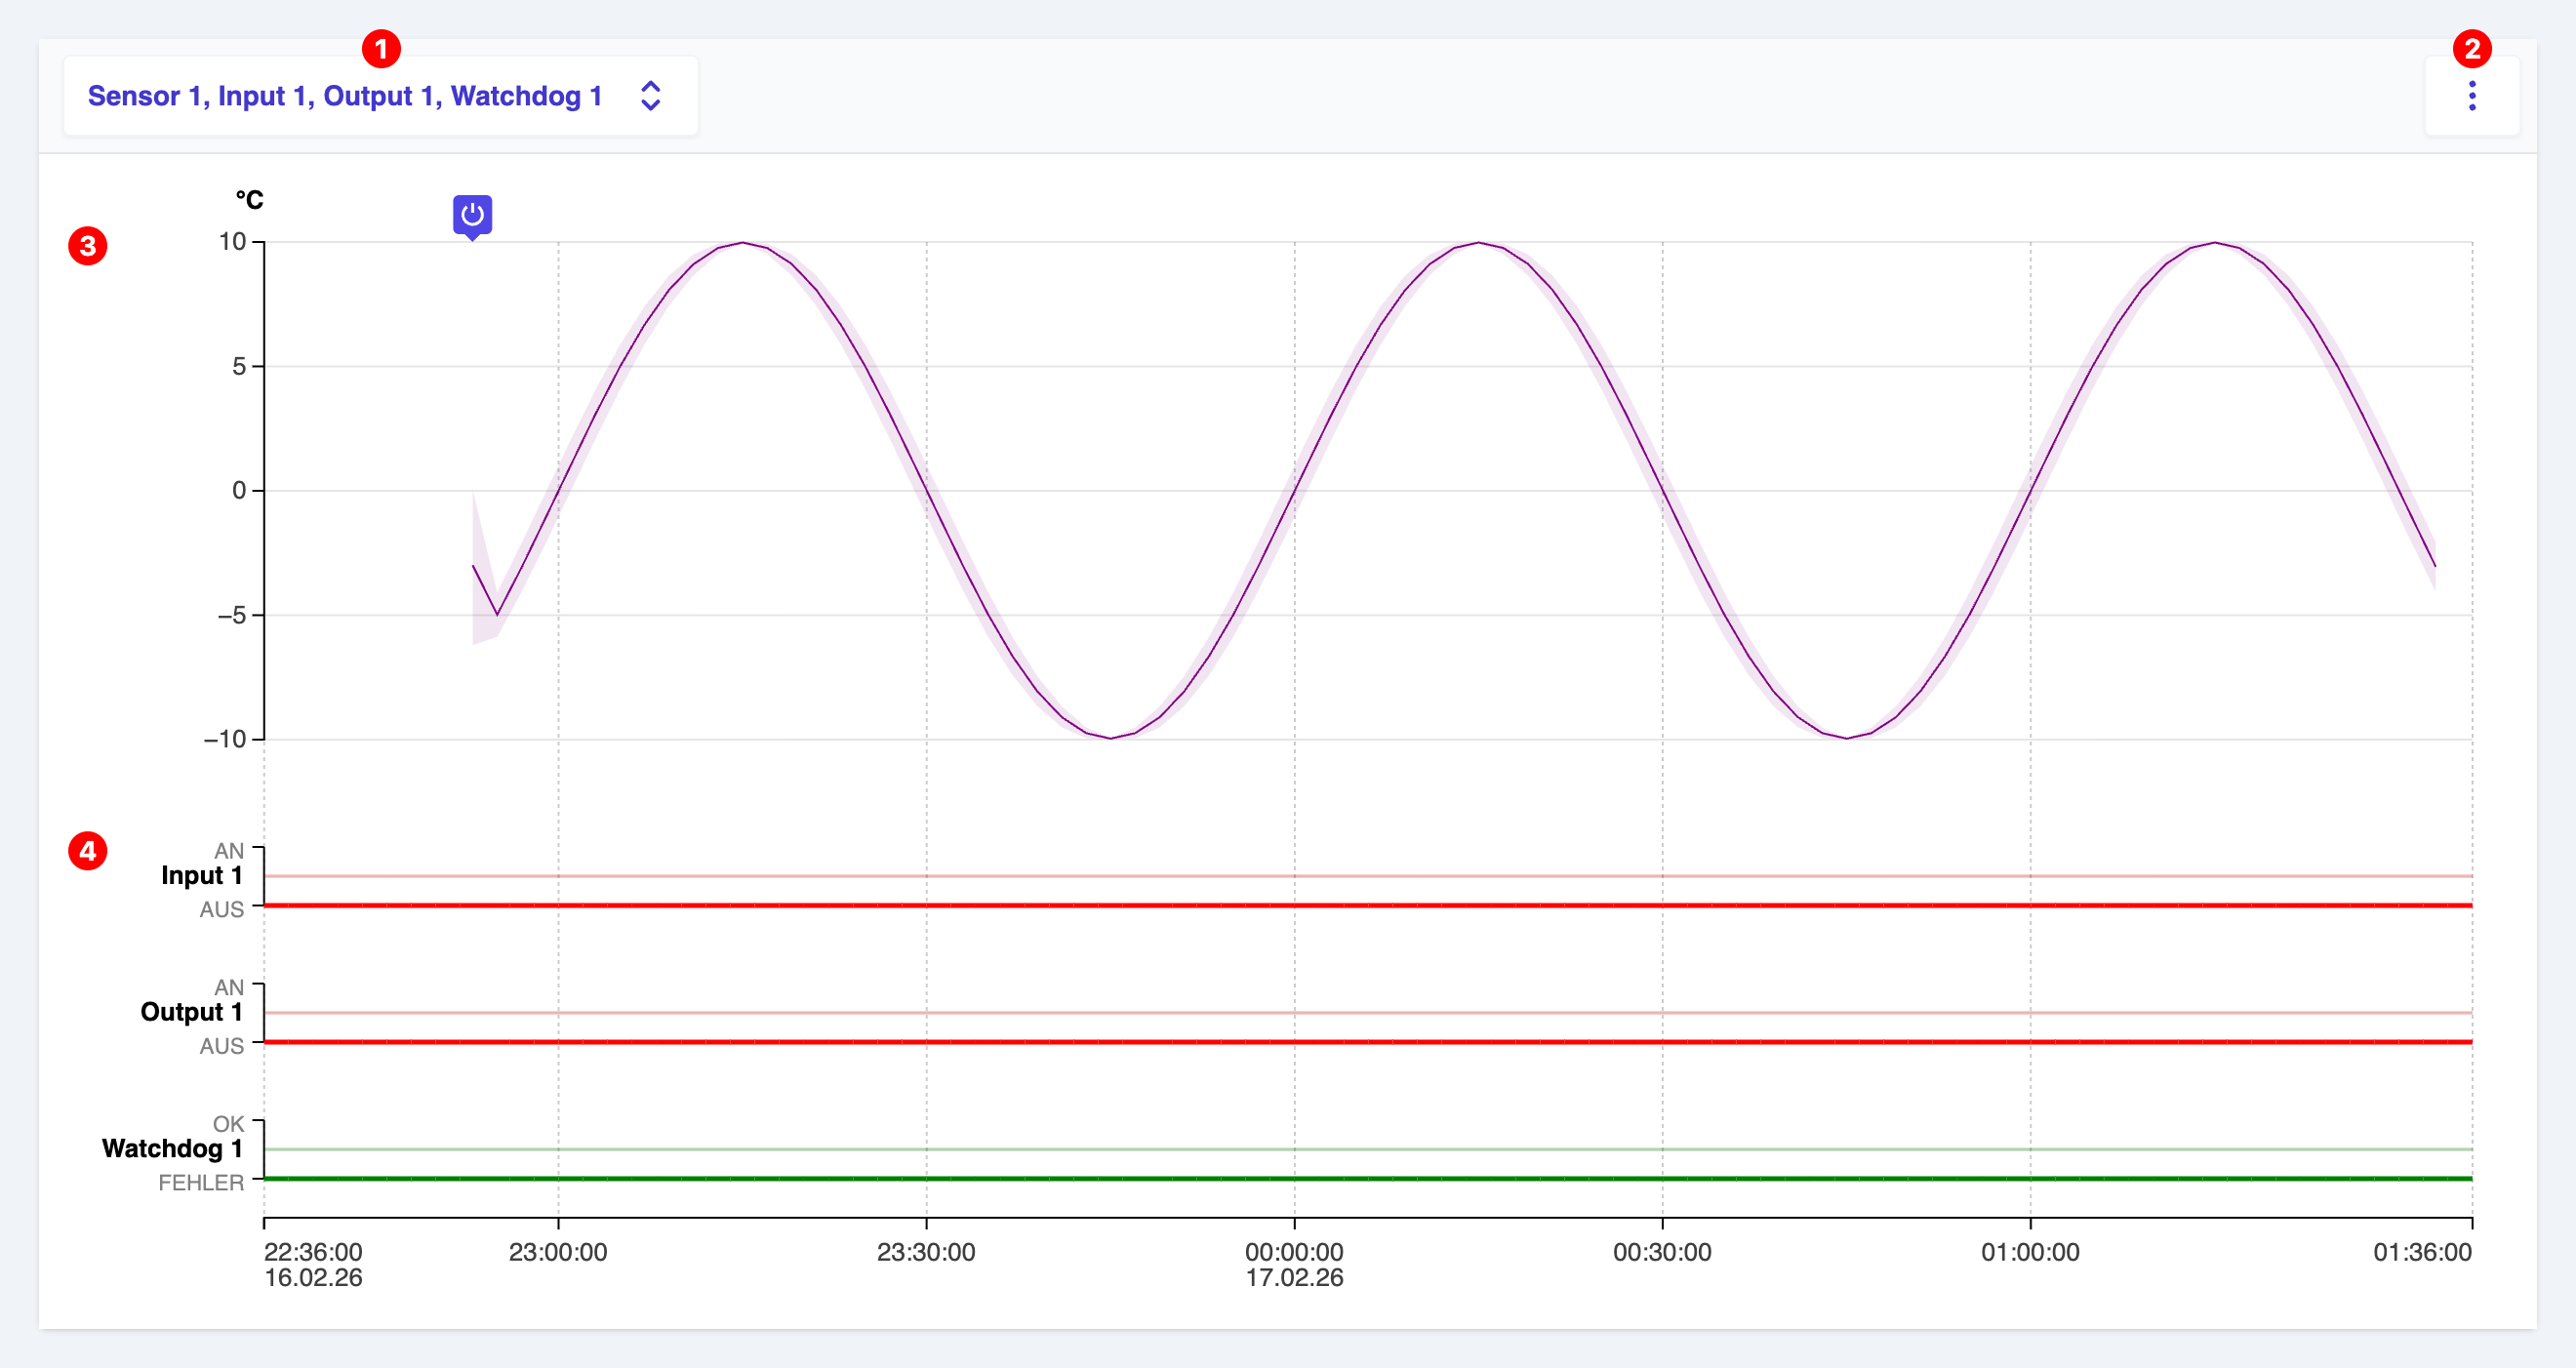
A chart widget consists of a top bar, with buttons for Data Selection
- 3A line chart for displaying sensor data. Multiple data rows can be displayed in this chart, if configured.
- 4One or more discrete event charts for displaying event data for Digital I/Os or Watchdogs.
depending on the settings made in the data selection panel.
Chart Menu
Click on the button on the top right of a chart widget
Here you can
- Enable the Fullscreen mode, to enlarge the chart
- Move up or Move Down the chart, relative to other charts, if added
- Remove the chart instance
Configuration and data selection
Click on the button on the top right of a chart widget
Here you can choose, which peripherals to include in the chart.
The panel is composed of rows, where each row corresponds to a peripheral.
To include the historical data of a peripheral in the chart, tick the checkmark in the corresponding row. On the right side of the row you will find a color picker, that you can optionally use to define a custom color for the data row to use in the line chart or event chart.
[Screenshot Groups]
On the bottom of the panel, there is a Groups section. If you have defined groups (see Peripherals), choosing a group from the drop down menu will select all peripherals belonging to that group automatically.